Quarterly results | NBFC
August 07, 2019
Shriram Transport Fin Co
BUY
CMP
1,000
Performance Highlights
Target Price
1,385
Particulars (` cr)
Q1FY20
Q4FY19
% chg (qoq)
Q1FY19
% chg (yoy)
Investment Period
12 Months
NII
1,962
1,906
2.9
1,823
7.6
Pre.Prov. Profit
1,543
1,512
2.0
1,406
9.7
Stock Info
PAT
634
746
(15)
573
10.7
Sector
NBFC
Source: Company, Angel Research
Market Cap (` cr)
22,286
For Q1FY2020, STFC has reported in-line numbers. For the quarter, PAT
Beta
1.4
increased 11% yoy, AUM growth continued to moderate at 6% yoy vs. 9% in
52 Week High / Low
1,450/903
Q4FY2019 and 22% in Q1FY2019. Key positive were stable asset quality with
Avg. Daily Volume
86,106
stage 3 at 8.5% and coverage +30% and credit cost for the quarter was 2.1%.
Face Value (`)
10
Management maintained credit cost guidance of 2% for FY2020.
BSE Sensex
36,690
AUM growth moderated; stable NIM: during the quarter, STFC reported AUM
Nifty
10,855
growth of 6% yoy, led by working capital (53% yoy on low base) and used vehicle
Reuters Code
SRTR.BO
loan (6% yoy). Used vehicle AUM led by M&CV segment grew at healthy rate of
Bloomberg Code
SHTF IN
15% yoy. Management guided for AUM growth of 15% yoy if growth improves in
2HFY2020 and increasing presence in rural area coupled with festive season,
which will support growth. NIM remained stable at 8.44% yoy (up 22bps qoq), as
Shareholding Pattern (%)
the company managed to pass incremental higher cost to borrowers.
Promoters
26.1
Asset quality steady; credit cost guidance maintained at 2%: Gross stage 3
MF / Banks / Indian Fls
8.1
increased marginally by 4%/declined 3% qoq /yoy. Provision for stage 3 declined
FII / NRIs / OCBs
56.4
by 259/222 bps qoq/yoy as it reversed additional provision made during Kerala
Indian Public / Others
9.4
flood. Management continued to guide credit cost for FY2020 at 2%.
Outlook & Valuation: We expect STFC’s AUM to grow at CAGR of 13% over
Abs.(%)
3m 1yr 3yr
FY2019-21E primarily owing to (1) post-election government to increase spending
Sensex
(1.1)
(2.6)
30.2
on infra project (macro recovery), and (2) pre-buying of CV before the BS VI will
SHTF
1.3
(29.5)
(22.4)
also improve the pricing of older vehicles. We expect STFC to report RoA/RoE to
2.7%/17.1% in FY2021E respectively. At CMP, the stock is trading at 1.2x
FY2021E ABV and 7x FY2021E EPS, which we believe is reasonable for
differentiated business model with return ratios. We recommend a BUY on the
stock with a Target Price of `1,385.
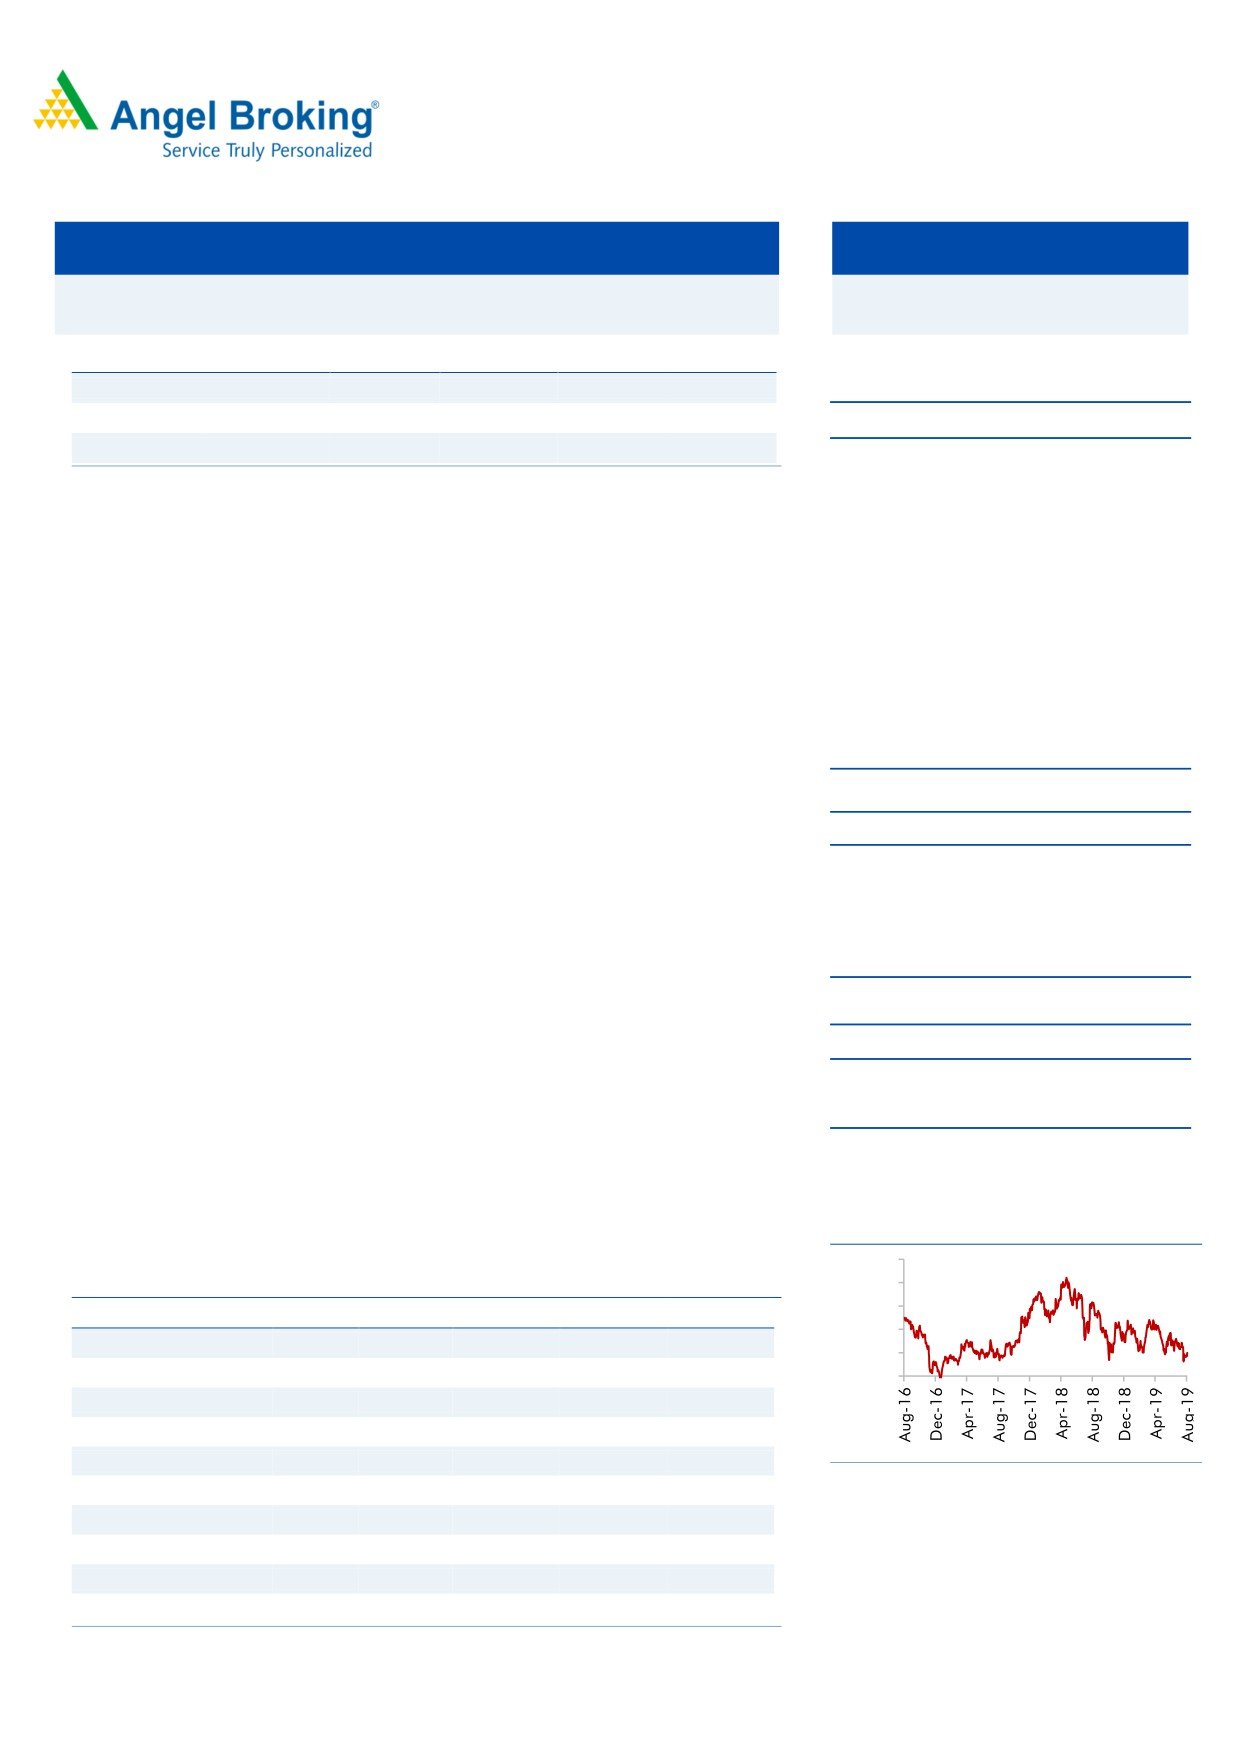
3 Year Price Chart
1800
Key Financials
1600
1400
Y/E March (` cr)
FY17
FY18
FY19
FY20E
FY21E
1200
NII
5,561
6,800
7,808
8,681
9,946
1000
YoY Growth (%)
10.1
22.3
14.8
11.2
14.6
800
PAT
1,257
2,460
2,562
2,868
3,405
YoY Growth (%)
6.7
95.7
4.2
11.9
18.7
EPS
55
108
113
126
150
Source: Company
Adj Book Value
425
504
607
697
815
P/E
18
9
9
8
7
P/Adj.BV
2.4
2.0
1.6
1.4
1.2
Jaikishan J Parmar
ROE (%)
11.7
19.8
17.4
16.7
17.1
Research Analyst
ROA (%)
1.8
2.9
2.5
2.6
2.7
022 39357600, Extn: 6810
[email protected]
Source: Company, Valuation done on closing price of 7/8/2019
Please refer to important disclosures at the end of this report
1
Quarterly results | Q1FY2020 Result Update
Exhibit 1: Income Statement
Particular (` cr)
1QFY19
2QFY19
3QFY19
4QFY19
Q1FY20
% QoQ
% YoY
Total Interest Income
3,712
3,917
3,968
3,845
4,001
4
8
Interest Expenses
1,889
1,862
1,941
1,939
2,040
5
8
Net Interest Income (NII)
1,823
2,055
2,027
1,906
1,962
3
8
Other Income
18
24
26
35
27
(21)
56
Total Income
3,729
3,942
3,994
3,880
4,029
4
8
Net Income
1,841
2,080
2,053
1,941
1,989
2
8
Operating Expenses
435
458
433
429
446.50
4
3
Employee Expenses
225
232
222
204
233
14
3
Other Operating Expenses
210
226
211
225
213
(5)
2
Operating Profit
1,406
1,622
1,620
1,512
1,543
2
10
Provisions
523
684
636
540
561
4
7
PBT
883
938
984
972
982
1
11
Provisions for Tax
310
329
348
226
347
54
12
Tax Rate %
35.1
35.1
35.4
23.3
35.4
52
1
PAT
573
609
635
746
634.2
(15)
11
Source: Company, Angel Research
Exhibit 2: Quarterly performance
AUM Mix (%)
1QFY19
2QFY19
3QFY19
4QFY19
Q1FY20
% QoQ
% YoY
New CV Loans
13
13
12
12
11
(35.7)bp
(123.3)bp
Used CV loans
87
87
88
88
89
35.7bp
124.3bp
Profitability (%)
NIM
7.44
7.52
7.44
7.22
7.44
22bp
0bp
C/I
23.6
22.0
21.1
22.1
22.4
35.3bp
(118)bp
ROE
17.2
17.0
17.2
19.4
15.8
(352.4)bp
(134.9)bp
Calc -Yield - AUM
15.16
15.29
15.25
14.77
15.18
41.7bp
2.3bp
Calc -Yield - Advance
18.31
18.40
18.42
18.13
18.86
72.4bp
54.5bp
Calc - COF
9.02
8.59
8.74
8.74
9.14
39.9bp
11.3bp
Spread
9.3
9.8
9.7
9.4
9.7
32.5bp
43.1bp
Source: Company, Angel Research
Exhibit 3: Break Up
Particular (` cr)
1QFY19
2QFY19
3QFY19
4QFY19
Q1FY20
% QoQ
% YoY
New
12,140
12,719
12,077
11,594
11,450
(1)
(6)
Used
83,919
86,057
86,126
87,050
89,021
2
6
Business Loan
2,978
3,314
3,182
2,971
2,912
(2)
(2)
Working Capital
1,895
2,171
2,365
2,807
2,898
3
53
Others
46
119
68
60
62
4
35
Total AUM
1,00,978
1,04,380
1,03,818
1,04,482
1,06,343
2
5
Source: Company, Angel Research
August 07, 2019
2
Quarterly results | Q1FY2020 Result Update
Exhibit 4: Asset Quality & Business Details
Particular (` Cr)
1QFY19
2QFY19
3QFY19
4QFY19
Q1FY20
% QoQ
% YoY
Credit Cost (Annualised) AUM (%)
2.1
2.6
2.5
2.1
2.1
(38)
166
GS 3
9,157
9,092
9,033
8,623
8,926
4
(3)
GS 3 %
9.11
8.71
8.70
8.25
8.52
26.7bp
(58.8)bp
ECL Prov. stage 3
3,118
3,113
3,187
2,967
2,841
(4)
(9)
Net Stage 3
6,039
5,979
5,846
5,656
6,085
8
1
Coverage Ratio Stage 3 (%)
34
34
35
34
32
(258.5)bp
(222.6)bp
GS 1& 2
91,879
96,173
93,875
94,358
95,889
2
4
ECL Prov. stage 1& 2
2,341
2,604
2,651
2,604
2,762
6
18
Net Stage 1 & 2
89,538
93,568
91,224
91,755
93,127
1
4
ECL Prov. (%) Stage 1&2
2.55
2.71
2.82
2.76
2.88
12bp
33bp
Business Details ()
AUM
1,00,541
1,04,380
1,03,818
1,04,482
1,06,343
2
6
Disbursement
13,425
13,799
9,550
11,959
12,300
3
(8)
New
2,470
2,300
400
8,100
890
(89)
(64)
Old
10,960
11,510
9,020
11,020
11,260
2
3
On book Loans
82,462
87,815
84,533
85,085
84,661
(0)
3
Off book (Securitization)
18,079
16,565
19,285
17,223
19,750
15
9
DA
38
24
1,721
2,175
1,942
(11)
5,011
Source: Company, Angel Research
Exhibit 5: 1 year forward P/B
4
P/BV
Avg. P/BV
+1STD
-1STD
3.5
3
3.07
2.65
2.5
2.19
2
1.5
1.73
1.43
1.38
1
0.5
0
Source: Company, Angel Research
August 07, 2019
3
Quarterly results | Q1FY2020 Result Update
Income Statement
Y/E March ( `cr)
FY17
FY18
FY19
FY20E
FY21E
NII
5,561
6,800
7,808
8,681
9,946
- YoY Growth (%)
10.1
22.3
14.8
11.2
14.6
Other Income
82
215
101
111
126
- YoY Growth (%)
-55.5
162.8
-53.0
9.9
13.1
Operating Income
5,643
7,015
7,909
8,793
10,072
- YoY Growth (%)
7.8
24.3
12.7
11.2
14.5
Operating Expenses
1,275
1,492
1,750
1,996
2,265
- YoY Growth (%)
-5.4
17.0
17.3
14.0
13.5
Pre - Provision Profit
4,368
5,524
6,159
6,797
7,806
- YoY Growth (%)
12.3
26.4
11.5
10.4
14.9
Prov. & Cont.
2,444
1,722
2,382
2,452
2,647
- YoY Growth (%)
16.0
-29.5
38.3
2.9
8.0
Profit Before Tax
1,924
3,801
3,776
4,345
5,159
- YoY Growth (%)
8.0
97.6
-0.7
15.1
18.7
Prov. for Taxation
667
1,341
1,214
1,477
1,754
- as a % of PBT
34.6
35.3
32.1
34.0
34.0
PAT
1,257
2,460
2,562
2,868
3,405
- YoY Growth (%)
6.7
95.7
4.2
11.9
18.7
Balance Sheet
Y/E March ( `cr)
FY17
FY18
FY19
FY20E
FY21E
Share Capital
227
227
227
227
227
Reserve & Surplus
11,075
13,349
15,609
18,186
21,246
Net worth
11,302
13,576
15,836
18,413
21,473
Borrowing
53,110
82,131
87,968
97,644
1,11,315
- YoY Growth (%)
6.7
54.6
7.1
11.0
14.0
Other Liab. & Prov.
9,998
1,539
1,487
1,524
1,744
Total Liabilities
74,410
97,245
1,05,291
1,17,581
1,34,532
Investment
1,549
2,341
3,999
3,999
3,999
Cash
4,441
3,675
3,981
4,615
5,242
Advance
65,463
90,738
96,751
1,08,361
1,24,615
- YoY Growth (%)
5.8
38.6
6.6
12.0
15.0
Fixed Asset
84
120
147
154
162
Other Assets
2,874
383
413
452
513
Total Asset
74,410
97,257
1,05,291
1,17,581
1,34,532
Growth (%)
9.5
30.7
8.3
11.7
14.4
August 07, 2019
4
Quarterly results | Q1FY2020 Result Update
Exhibit 6: Key Ratio
Y/E March
FY17
FY18
FY19
FY20E
FY21E
Profitability ratios (%)
NIMs
8.5
8.5
8.1
8.1
8.3
Cost to Income Ratio
22.6
21.3
22.1
22.7
22.5
RoA
1.8
2.9
2.5
2.6
2.7
RoE
11.7
19.8
17.4
16.7
17.1
Asset Quality (%)
Gross NPAs
8.20
9.15
8.3
8.0
7.5
GNPA (` Cr)
5,408
7,376
7,100
8,669
9,346
Net NPAs (%)
2.7
2.83
2.6
2.4
2.4
NPA (` Cr)
1,659
2,131
2,055
2,601
2,991
Provision Coverage
67.1
69.1
69.2
70.0
68.0
Credit Cost (AUM)
3.1
1.8
2.3
2.1
1.9
Per Share Data (`)
EPS
55
108
113
126
150
ABVPS
425
504
607
697
815
DPS
10
11
11
13
15
BVPS
498
598
698
812
946
Valuation Ratios
PER (x)
18.0
9.2
8.9
7.9
6.7
P/ABVPS (x)
2.4
2.0
1.6
1.4
1.2
P/BVPS
2.0
1.7
1.4
1.2
1.1
Dividend Yield
1.0
1.1
1.1
1.3
1.5
DuPont Analysis
NII
7.8
7.9
7.7
7.8
7.9
(-) Prov. Exp.
3.4
2.0
2.4
2.2
2.1
Adj. NII
4.4
5.9
5.4
5.6
5.8
Other Inc.
0.1
0.3
0.1
0.1
0.1
Op. Inc.
4.5
6.2
5.5
5.7
5.9
Opex
1.8
1.7
1.7
1.8
1.8
PBT
2.7
4.4
3.7
3.9
4.1
Taxes
0.9
1.6
1.2
1.3
1.4
RoA
1.8
2.9
2.5
2.6
2.7
Leverage
6.6
6.9
6.9
6.5
6.3
RoE
11.7
19.8
17.4
16.7
17.1
Valuation done on closing price of 07/08/2019
August 07, 2019
5
Quarterly results | Q1FY2020 Result Update
Research Team Tel: 022 - 39357800
E-mail: [email protected]
Website: www.angelbroking.com
DISCLAIMER:
Angel Broking Limited (hereinafter referred to as “Angel”) is a registered Member of National Stock Exchange of India Limited,
Bombay Stock Exchange Limited, Metropolitan Stock Exchange Limited, Multi Commodity Exchange of India Ltd and National
Commodity & Derivatives Exchange Ltd It is also registered as a Depository Participant with CDSL and Portfolio Manager and
Investment Adviser with SEBI. It also has registration with AMFI as a Mutual Fund Distributor. Angel Broking Limited is a
registered entity with SEBI for Research Analyst in terms of SEBI (Research Analyst) Regulations, 2014 vide registration number
INH000000164. Angel or its associates has not been debarred/ suspended by SEBI or any other regulatory authority for
accessing /dealing in securities Market. Angel or its associates/analyst has not received any compensation / managed or co-
managed public offering of securities of the company covered by Analyst during the past twelve months.
This document is solely for the personal information of the recipient, and must not be singularly used as the basis of any
investment decision. Nothing in this document should be construed as investment or financial advice. Each recipient of this
document should make such investigations as they deem necessary to arrive at an independent evaluation of an investment in
the securities of the companies referred to in this document (including the merits and risks involved), and should consult their
own advisors to determine the merits and risks of such an investment.
Reports based on technical and derivative analysis center on studying charts of a stock's price movement, outstanding positions
and trading volume, as opposed to focusing on a company's fundamentals and, as such, may not match with a report on a
company's fundamentals. Investors are advised to refer the Fundamental and Technical Research Reports available on our
website to evaluate the contrary view, if any
The information in this document has been printed on the basis of publicly available information, internal data and other
reliable sources believed to be true, but we do not represent that it is accurate or complete and it should not be relied on as
such, as this document is for general guidance only. Angel Broking Limited or any of its affiliates/ group companies shall not be
in any way responsible for any loss or damage that may arise to any person from any inadvertent error in the information
contained in this report. Angel Broking Limited has not independently verified all the information contained within this
document. Accordingly, we cannot testify, nor make any representation or warranty, express or implied, to the accuracy,
contents or data contained within this document. While Angel Broking Limited endeavors to update on a reasonable basis the
information discussed in this material, there may be regulatory, compliance, or other reasons that prevent us from doing so.
This document is being supplied to you solely for your information, and its contents, information or data may not be
reproduced, redistributed or passed on, directly or indirectly.
Disclosure of Interest Statement
Shriram Transport Fin
1. Financial interest of research analyst or Angel or his Associate or his relative
No
2. Ownership of 1% or more of the stock by research analyst or Angel or associates or relatives
No
3. Served as an officer, director or employee of the company covered under Research
No
4. Broking relationship with company covered under Research
No
Ratings (Based on expected returns
Buy (> 15%)
Accumulate (5% to 15%)
Neutral (-5 to 5%)
Over 12 months investment period):
Reduce (-5% to -15%)
Sell (< -15)